August 2019 House Price Forecast
-
08 August 2019
-
By Global Administrator
September 2019 will see largest annual increases in house prices for nearly a year

- Analysis of sale prices agreed in early summer suggests house prices will continue steady climb
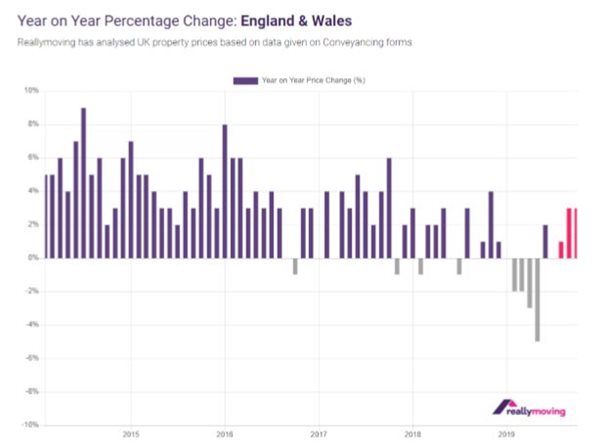
- Annual growth to hit 2.8% in October, after 3.1% in September, the highest level since November 2018
- Average prices are set to rise by 1.5% in the three months between July and October 2019
- Price growth supported by urgency to complete deals before Brexit deadline
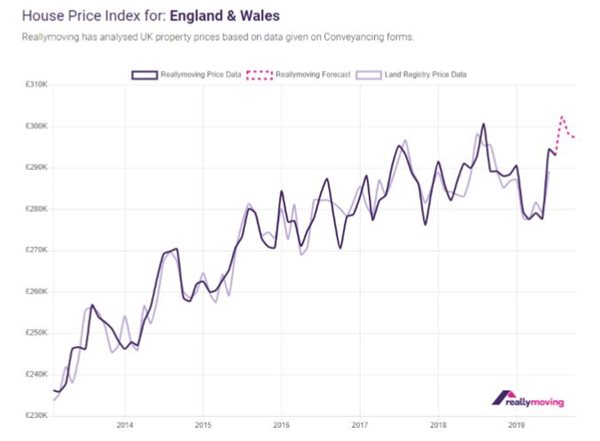
Annual growth in house prices in England and Wales will reach 3.1% in September and 2.8% in October, the highest level seen since November 2018, according to the reallymoving House Price Forecast released today, as buyers race to complete deals before the Brexit deadline of 31st October.
Graph 1: reallymoving House Price Index (England and Wales) including 3-month price forecast

Average values are set to rise by 1.5% over the next three months (August to October 2019), continuing their steady climb. Particularly strong growth in August will see prices increase by 3.2%, before dipping by -1.4% in September.
As homebuyers register for quotes for home move services on the site typically twelve weeks before their purchase completes, reallymoving is able to provide an accurate three-month property price forecast based on the purchase price agreed. They also provide both seasonally and mix adjusted data, accounting for the seasonal trends in house prices and variations in the location and types of properties quoted for. Historically, reallymoving’s data has closely tracked the Land Registry’s Price Paid data, published retrospectively.
Monthly price changes
Against a backdrop of economic and political uncertainty, the housing market has performed remarkably strongly through the early summer, with a 6.0% surge in prices in June and a further 3.2% increase forecast in August. This resilience is most likely driven by a significant pent up demand from homeowners who need to move but have held off during recent months and years, who now fear the window up to October could represent their best opportunity. While buyers are being selective and seeking bargains, there is also a lack of stock which is helping support values. HMRC have released figures showing that 16.5% fewer property deals were made in June 2019 compared to June 2018, further supporting the idea that a discrepancy between supply and demand of properties is partially responsible for driving the increase in house prices.
Annual price changes
Annual price growth has been in positive territory since June and will remain so for the next three months, with prices in October forecast to be 2.8% higher than twelve months previously. This is the highest rate of annual growth seen for nearly a year, since November 2018. Underlying conditions in the broader economy continue to underpin the housing market and support year on year price growth, particularly high employment levels, low interest rates and rising household incomes.
Graph 2: Year on Year average price changes (England and Wales) including 3-month forecast


Regional 3-month price forecasts
More than half of the UK’s regions are set to see prices rise over the next three months, with notable increases in the South East (7.0%), Wales (6.7%) and the East Midlands (5.3%), as the housing market in most parts of the UK continues to show resilience. London too is set to see a bounce of 2.6% over the next three months, suggesting price falls in the capital may have bottomed out following a difficult period bearing the brunt of Brexit housing market woes. Annually, average house prices in London are on track to be 9% higher in October 2019 than October 2018, albeit that values in October 2018 were particularly low. The housing market in the North East and Yorkshire and the Humber, meanwhile, is heading for a more tumultuous period, with prices set to fall by 5.4% and 0.3% respectively over the next three months. This could be due to higher stock levels in those areas resulting in greater competition among sellers.
Graph 3: reallymoving House Price Index (South East) including 3-month price forecast
Reallymoving’s online
Property Price Forecast is an interactive tool providing house price information and forecasts for every region of the UK, from January 2013 to present, alongside Land Registry price paid data. Highlighting the South East this month, prices are set to surge by 7% in August and then remain stable at 0% change until October. Following the trend in London, annual growth in the South East is forecast to remain consistently positive, with average prices in October 8% higher than October 2018, at £401,482.

Analysis and commentary
Rob Houghton, CEO of reallymoving, comments:
“The outlook for the property market over the next three months is remarkably positive, considering the current political and economic context. The recent election of a new Prime Minister who is committed to leaving the EU on Halloween even if a deal isn’t reached could mean clouds are gathering on the horizon, but any impact on prices in the short term is likely to be mitigated by the urgency of home movers to complete deals in the next three months.
“While the longer term outlook remains uncertain, we could see a Boris Bounce in the property market if he is true to his word over stamp duty reform and stimulates the market through tax cuts at the top and bottom. Scrapping stamp duty for downsizers could be a cost-effective way to stimulate activity throughout the market, freeing up family homes and enabling chains of transactions, at relatively little cost.
“Annually, house prices in October are on track to be 2.8% higher than they were in October 2018, which is further evidence that home movers have become tired of the wait and see approach and decided to move on with their lives.”
We've already helped over 2,882,908 movers
Easy to get 4 instant quotes - a range of prices which was interesting.
FizzB on 03/11/2023